Color Vision Deficiency: How to Test Interface Design
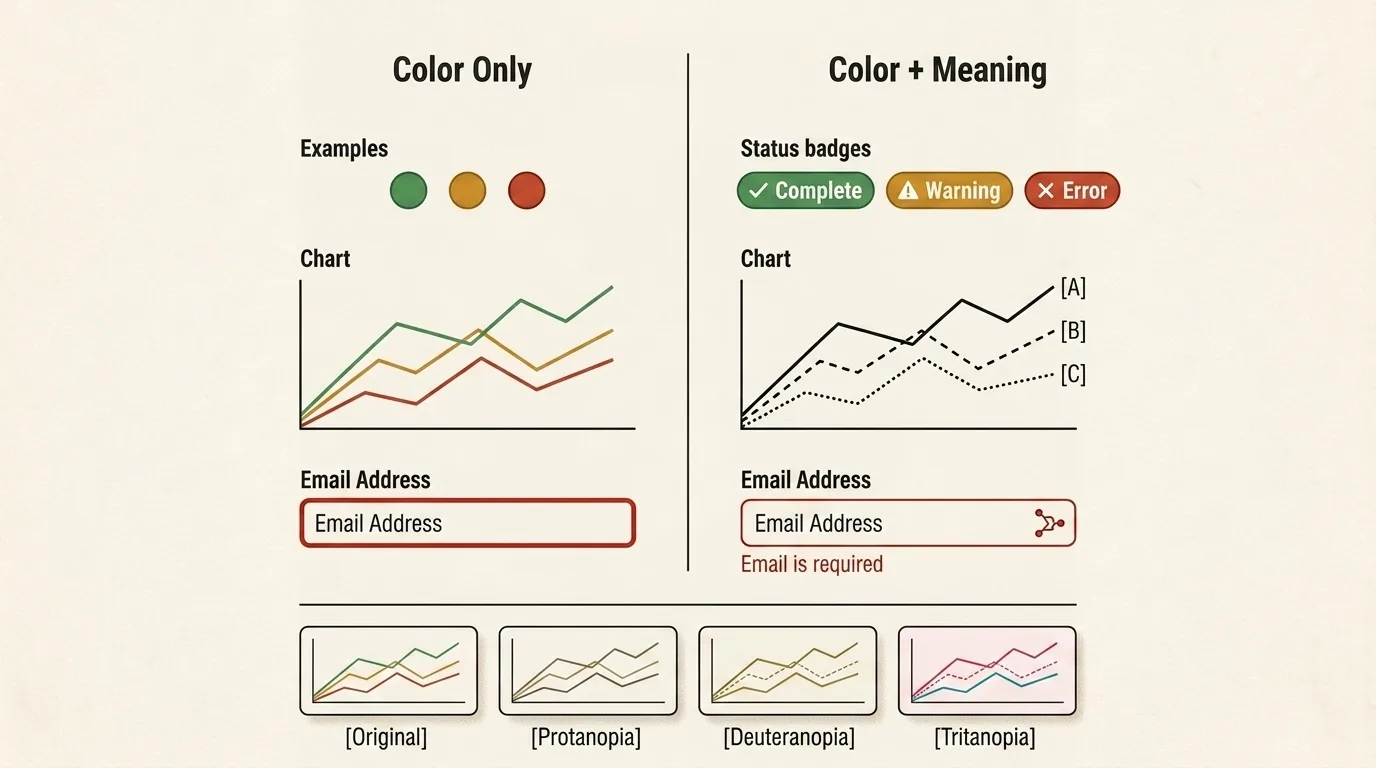
If an error is marked only in red, success only in green, and two chart lines differ only by hue, an interface can lose meaning for some users. A simulator helps expose that risk, but it does not open a literal window into another person's vision. Its job is narrower and more practical: reveal which elements become similar under a simplified color transformation, then make the designer check whether text, shape, icons, and contrast still carry the message.
Dalton described his own perception rather than discovering color blindness in a day
On October 31, 1794, John Dalton presented observations about how he and his brother distinguished colors to the Manchester Literary and Philosophical Society. In the paper published in 1798 as Extraordinary Facts Relating to the Vision of Colours, he reported confusing scarlet with green and pink with blue, then tried to connect those experiences to the structure of the eye. It became the first detailed scientific account of a person's own color vision deficiency, although differences in color perception had of course existed long before it.
Dalton proposed that his vitreous humor was tinted and absorbed part of the spectrum, so he left instructions for his eyes to be examined after death. The ocular media proved clear in 1844, and a century and a half later researchers could test another part of the story. A 1995 study extracted DNA from preserved eye tissue and found that Dalton lacked the middle-wave photopigment, establishing deuteranopia rather than the milder deuteranomaly.
The word Daltonism preserved his name in several languages, but color vision deficiency is more precise in medicine and accessible design. Most affected people do see colors while distinguishing some combinations less reliably. Phrases such as “cannot see red” or “the whole world looks yellow and blue” reduce a complex perceptual difference to an overly literal filter.
The Ishihara test was built for screening, not simulation
In 1917, Japanese ophthalmologist Shinobu Ishihara published his first plates made from fields of colored dots. A numeral or path is selected so that it merges with the background, disappears, or reads differently for certain red-green deficiencies. The test was fast and practical, which is why pseudoisochromatic plates remain common in initial screening more than a century later. The AAO history of ophthalmology dates Ishihara's test to 1917, while clinical comparisons describe its role specifically along the red-green confusion axis.
A picture on an uncalibrated screen is not equivalent to a clinical plate. Display profile, brightness, ambient light, scaling, and image compression alter the stimulus, and Ishihara plates were not designed to classify every blue-yellow or acquired deficiency. An online plate may suggest that professional testing would be useful, but it cannot determine a diagnosis or severity. A simulator performs the reverse operation anyway: it changes an image for an observer with typical color vision rather than examining the vision of the person looking at the screen.
Similar names can describe different mechanisms
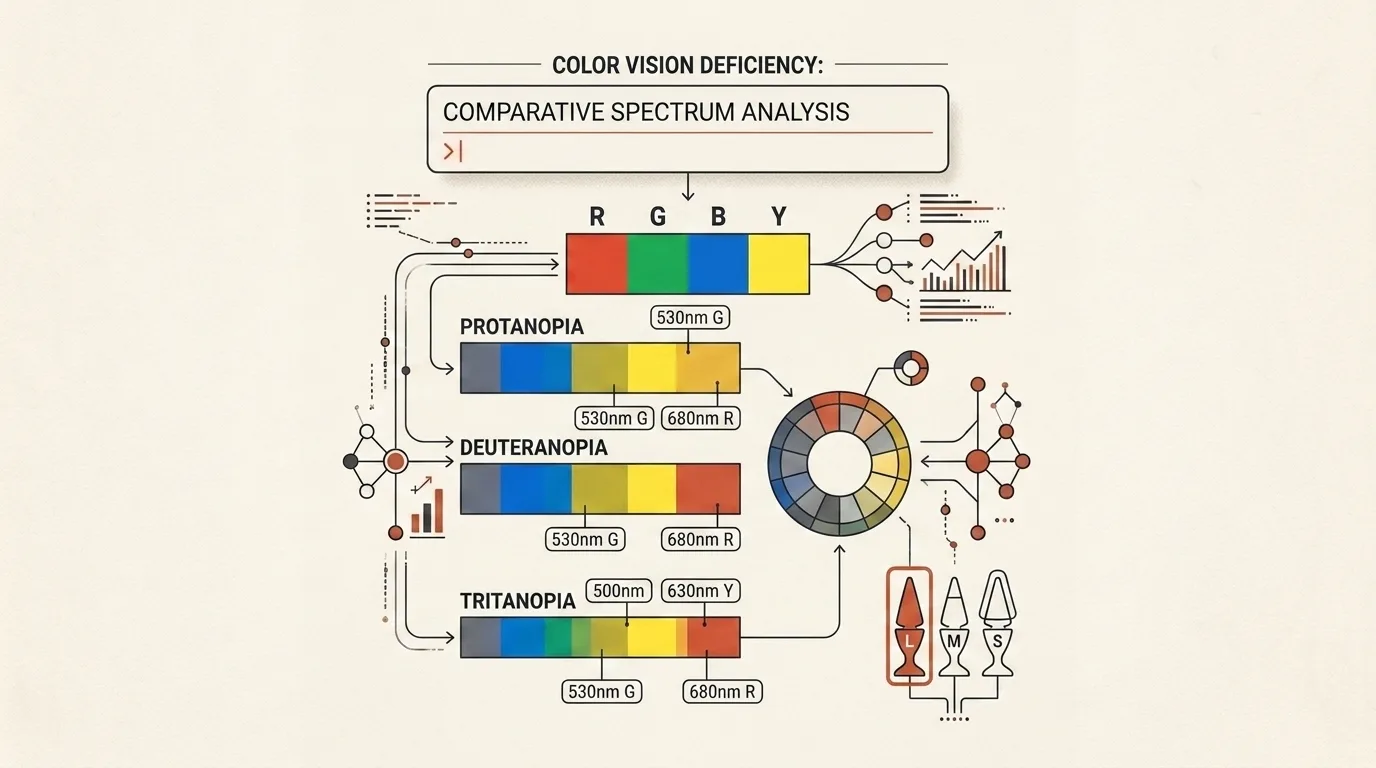
Daylight color vision begins with three classes of cones whose sensitivities overlap across long, medium, and short wavelengths. Calling them red, green, and blue cones is convenient shorthand, not a set of narrow color detectors. Each class responds across a broad spectral range, and color arises from comparing their signals.
In anomalous trichromacy, all three channels remain but the sensitivity of one is shifted. Deuteranomaly affects the medium-wave channel and is the most common inherited red-green variant; protanomaly involves the long-wave channel, while tritanomaly involves the short-wave channel. Discrimination can vary considerably in severity, so one fixed filter cannot represent everyone who shares the same diagnostic label.
In dichromacy, one effective channel is absent. Protanopia concerns the long-wave photopigment, deuteranopia the middle-wave pigment, and tritanopia the short-wave pigment. This does not mean that a person literally sees a scene in two named colors. Instead, the space of distinguishable color stimuli becomes smaller, allowing different original hues to produce the same pair of signals. The National Eye Institute lists anomalous and dichromatic variants separately and shows why red-green and blue-yellow name groups of likely confusions rather than a color being switched off.
Achromatopsia should not be treated as the strongest setting on the same slider. It is a rare inherited disorder of cone function in which absent or severely reduced color discrimination is often accompanied by light sensitivity, nystagmus, and reduced visual acuity. GeneReviews estimates a prevalence below 1 in 30,000 and describes both complete and incomplete forms. Removing color from an image cannot reproduce those associated symptoms.
Prevalence depends on the population and the condition being counted
The familiar figures of 8% of men and 0.5% of women refer chiefly to inherited red-green deficiencies among people of Northern European ancestry. The same GeneReviews chapter gives estimates of 3–4% for men of African ancestry and roughly 3% for men of Asian ancestry. Applying 8% to every product audience, or multiplying it by the world's population to produce a precise global total, therefore misuses a population-specific estimate.
The sex difference occurs because the long- and middle-wave opsin genes are on the X chromosome, so variants are more likely to be expressed in people who have one X chromosome. The short-wave pathway has a different genetic basis, and color vision deficiency is not always inherited. Eye and neurological disease, aging, and some medications can produce acquired changes. One universal percentage would collapse distinct mechanisms and populations into a misleading number.
An accessible interface keeps its meaning without naming a hue
The design rule is simpler than the medical classification: users should understand an element's state without having to identify its color. WCAG 2.2 Success Criterion 1.4.1 explicitly says color must not be the only visual means of conveying information, an action, or a requested response. Color is still welcome as a useful cue when another visual signal carries the same meaning.
Several recurring cases deserve a deliberate check:
- a form error gets text, an icon, and a visible field state instead of only a red border;
- success, warning, and error have words plus distinct icons or shapes;
- chart lines and regions receive direct labels, different strokes, or patterns;
- a link in body text is underlined or distinguished by more than hue;
- a selected item gains a check mark, outline, or position change instead of only a fill color.
Contrast needs its own test. Level AA requires at least 4.5:1 for normal text and 3:1 for large text; those ratios measure luminance contrast between text and background, as WCAG 1.4.3 explains. A simulation may reveal that two states have become difficult to distinguish, but it does not calculate a contrast ratio or establish WCAG conformance.
What Color Blindness Simulator actually does
Color Blindness Simulator accepts a local image or generates a sample palette, then places the original beside one of four transformed versions: Protanopia, Deuteranopia, Tritanopia, or Achromatopsia. The browser decodes the image into a Canvas and multiplies each RGB pixel by a fixed 3×3 matrix. In the Achromatopsia mode, all three channels receive the same grayscale value using coefficients 0.299, 0.587, and 0.114.
This transformation quickly flags palettes that depend too heavily on hue, but its limits matter. The implementation does not simulate protanomaly, deuteranomaly, or tritanomaly, offer a severity control, or implement the Brettel–Viénot LMS projection or Machado's severity-aware model. Scientific algorithms are still models rather than direct recordings of experience; the authors of the classic Brettel, Viénot, and Mollon paper explicitly noted that another person's subjective sensations can never be known with certainty.
The tool also does not check WCAG contrast, export the transformed image, or provide a medical diagnosis. A sensible workflow has three steps: upload a screenshot, inspect all four filters for distinctions or meanings that disappear, then repair those places with labels, shape, and patterns. Use a dedicated calculator for contrast afterward, and involve people with color vision deficiencies in testing when the decision is important. Image processing stays in local browser memory, so the uploaded file is not sent to a server.
Related tools


Frequently asked questions
Who first described color vision deficiency scientifically?
John Dalton presented an account of his own color perception to the Manchester Literary and Philosophical Society in 1794, and Extraordinary Facts Relating to the Vision of Colours was published in 1798. DNA from his preserved eye tissue showed in 1995 that Dalton had deuteranopia, not deuteranomaly.
How common is color vision deficiency?
There is no single worldwide percentage. Red-green deficiencies occur in about 8% of men and 0.5% of women of Northern European ancestry, but estimates are lower among men of African and Asian ancestry. Prevalence depends on population, sex, the type being counted, and whether acquired conditions are included.
How does anomalous trichromacy differ from dichromacy?
In anomalous trichromacy, all three cone classes function but the spectral sensitivity of one class is shifted; protanomaly, deuteranomaly, and tritanomaly belong here. In dichromacy, one effective channel is absent, producing protanopia, deuteranopia, or tritanopia. These conditions can cause different degrees of lost color discrimination.
Can a simulator or an online Ishihara test diagnose color vision?
No. A simulator transforms an image for a viewer with typical color vision and does not examine the viewer's eyes. Ishihara plates primarily screen for red-green deficiencies, and their validity depends on printing, lighting, and test conditions. Diagnosis requires a qualified professional using suitable tests.
What does WCAG require when color conveys information?
WCAG 2.2 Success Criterion 1.4.1 says color must not be the only visual means of conveying information, an action, or a state. For text, Criterion 1.4.3 at Level AA requires 4.5:1 contrast for normal text and 3:1 for large text. Redundant cues and contrast measurement are separate checks.
Can a simulator show exactly what another person sees?
No. It models the loss of some color distinctions on a particular display. A simple RGB matrix does not capture individual severity, adaptation, lighting, display characteristics, or acquired changes in vision. Treat the output as a warning signal rather than an exact copy of another person's perception.